MENU
NO | EUR

NO | EUR
-
- All Centrifuges
- Benchtop Centrifuges
- Floor-Standing Centrifuges
- Refrigerated Centrifuges
- Microcentrifuges
- Multipurpose Centrifuges
- High-Speed Centrifuges
- Ultracentrifuges
- Concentrator
- IVD Products
- High-Speed and Ultracentrifuge Consumables
- Centrifuge Tubes
- Centrifuge Plates
- Device Management Software
- Sample and Information Management
-
- All Pipettes, Dispensers & Automated Liquid Handlers
- Mechanical Pipettes
- Electronic Pipettes
- Multi-Channel Pipettes
- Positive Displacement Pipettes & Dispensers
- Pipette Tips
- Bottle-Top Dispensers
- Pipette Controllers
- Dispenser & Pipette Accessories
- Automated Pipetting
- Automation Consumables
- Automation Accessories
- Liquid Handler & Pipette Services
Sorry, we couldn't find anything on our website containing your search term.
Sorry, we couldn't find anything on our website containing your search term.
Photometric Quantification of Proteins in Aqueous Solutions – Colorimetric Assay
Lab Academy
- Photometry
- Photometers
- Essay
This paper introduces different colorimetric processes that are frequently employed in the laboratory for the purpose of protein quantification; these include the Bradford assay (1), the BCA assay (2) and the Lowry assay (3).
The major difference between these assays and the direct method of quantification is that quantification via the methods mentioned above relies on the intensity of a color reaction.
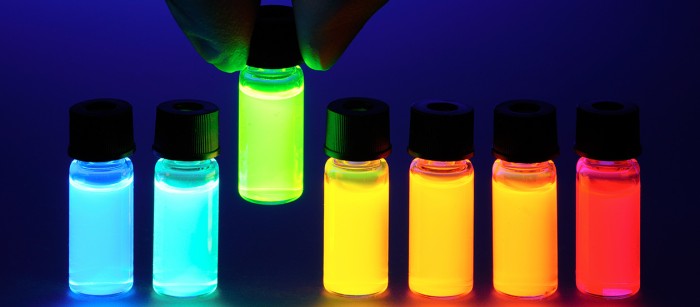
For this reaction to occur, certain factors must come together, or be present in the sample, respectively:
During the process of these colorimetric assays, protein and dye will form a complex, the creation of which is connected to a color change. The color change intensifies with increasing amounts of protein, and it can be measured via absorbance measurements using a photometer. In this case, the sample concentration is not calculated via a factor, as is the case for the UV-VIS method; rather, it is determined in an indirect fashion, using a previously established standard curve. To this end, several protein samples of known concentrations are generated and measured in ascending order following the addition of the respective assay reagent. By means of the progression of the curve, the unknown concentration of a protein sample can be determined (figure. 1).
For this reaction to occur, certain factors must come together, or be present in the sample, respectively:
- Protein to be detected
- Dye for the color reaction
- Certain defined environmental conditions such as pH, temperature, etc.
During the process of these colorimetric assays, protein and dye will form a complex, the creation of which is connected to a color change. The color change intensifies with increasing amounts of protein, and it can be measured via absorbance measurements using a photometer. In this case, the sample concentration is not calculated via a factor, as is the case for the UV-VIS method; rather, it is determined in an indirect fashion, using a previously established standard curve. To this end, several protein samples of known concentrations are generated and measured in ascending order following the addition of the respective assay reagent. By means of the progression of the curve, the unknown concentration of a protein sample can be determined (figure. 1).
Read more
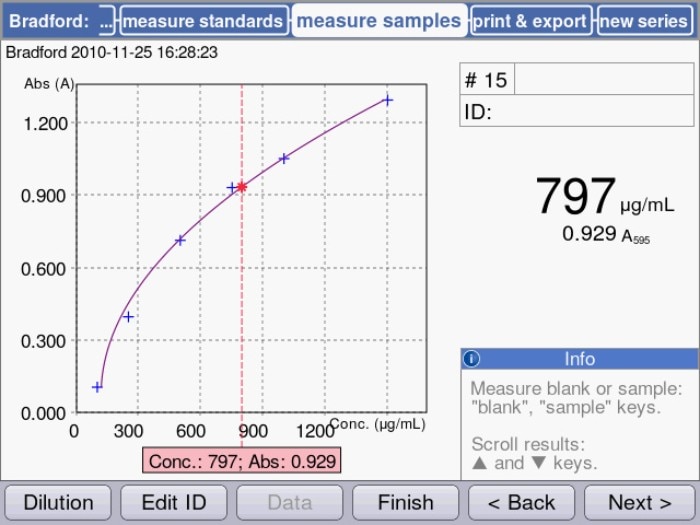
Figure.1: Quantification of a protein sample using a colorimetric assay (Bradford) in the Eppendorf BioSpectrometer®: Sample concentration is displayed in relation to the measured standard curve.
As shown in figure 1, the curve progression representing the lower concentration range of these assays is predominantly linear, but it tends to flatten out with increasing amounts of protein. In order to cover as broad a concentration range as possible, a regression method should be selected that best represents the actual curve progression. The Eppendorf BioSpectrometer and Eppendorf BioPhotometer® D30, for example, allow a choice between 5 different modes of evaluation of the standard curve (linear, quadratic and cubic regression as well as linear and spline interpolation) in order to optimally fit the curve progression.
It is recommended to generate a new standard curve for each sample measurement in order to ensure that measurement conditions will always be identical between the samples and the standard curves.
The following table shows an overview of the relevant advantages and disadvantages of the colorimetric quantification method in comparison with the direct quantification method:
Table 1: Advantages and disadvantages of colorimetric assays for the purpose of protein quantification
Read more
Advantages
- High sensitivity (up to 200-fold more sensitive than the direct method)
- Universally compatible
- Broader measuring range than with fluorescence-based methods and direct quantification methods
- Considerably cheaper than the fluorescent method
Read more
Disadvantages
- Occasionally the quantification of different proteins of identical concentrations is subject to very high variability.
- Depending on the method, the preparation time may be long.
- High sensitivity to salt content, detergents, DTT, reducing substances
Read more
As mentioned previously, molecular laboratories frequently employ the Bradford assay, the BCA assay and the Lowry assay for the purpose of protein quantification. Table 2 provides an overview of the most important method parameters.
Table 2: Colorimetric assays for the determination of protein concentrations (4)
Table 2: Colorimetric assays for the determination of protein concentrations (4)
Read more
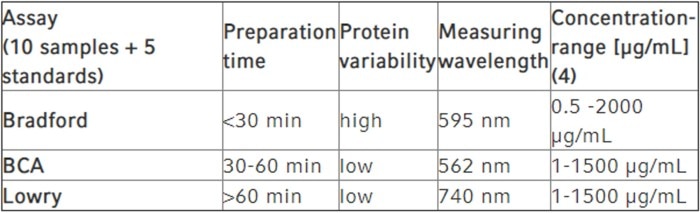
As shown in the table, the Bradford assay is well suited to quick protein quantification; however, accuracy is slightly reduced when it comes to the comparison between different proteins of identical concentrations. While the BCA assay and the Lowry assay are superior in this aspect, they take considerably longer to prepare. All three assays are more or less susceptible to distortion of their results by certain substances (see above).
[1] Bradford, M.M. A rapid and sensitive method for the quantitation of microgram quantities of protein utilizing the principle of protein-dye binding. Anal. Biochem. 1976; 72: 248-254.
[2] Smith, P.K., Krohn, R.I., Hermanson, G.T., Mallia, A.K., Gartner, F.H., Provenzano, M.D., Fujimoto, E.K., Goeke, N.M., Olson, B.J. and Klenk, D.C. Measurement of protein using bicinchoninic acid. Anal. Biochem. 1985; 150, 76-85.
[3] Lowry, O.H., Rosebrough, N.J., Farr, A.L., Randall, R.J., Protein measurement with the Folin phenol reagent., J Biol Chem. 1951 Nov;193(1):265-75.
[4] Lottspeich/Zsorbas – Bioanalytik, Spektrum Akademischer Verlag, 1998
Read more