MENU
MY | MYR

MY | MYR
-
- All Pipettes, Dispensers & Automated Liquid Handlers
- Mechanical Pipettes
- Electronic Pipettes
- Multi-Channel Pipettes
- Positive Displacement Pipettes & Dispensers
- Bottle-Top Dispensers
- Pipette Controllers
- Dispenser & Pipette Accessories
- Automated Pipetting
- Automation Consumables
- Automation Accessories
- Liquid Handler & Pipette Services
Sorry, we couldn't find anything on our website containing your search term.
You are about to leave this site.
Please be aware that your current cart is not saved yet and cannot be restored on the new site nor when you come back. If you want to save your cart please login in into your account.
Sorry, we couldn't find anything on our website containing your search term.
Enzyme Kinetic Assays – How Does It Work?
Natascha Weiß Lab Academy
- Cell Biology
- Molecular Biology
- Lab Routine
- Photometry
- Photometers
- Essay
What is an enzyme assay? What is required to perform it and how is the analysis carried out? Learn more …
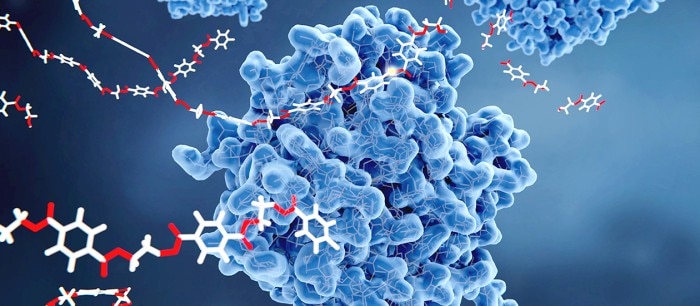
Enzymes reduce the activation energy of biochemical reactions and are thus capable of significantly accelerating these reactions. These molecules, also known as biocatalysts, are not used up during the reaction. While most enzymes are proteins, they may also contain an additional nonprotein component. Enzymes are characterized by binding to a specific substrate or group of substrates, which then forms the enzyme-substrate complex. Within a specific reaction, the substrate is converted into a product (Figure 1). The activity of an enzyme is equivalent to the reaction speed: It is defined by the amount of substrate that is converted within a specified period of time and the amount of product that is produced, respectively.
Read more
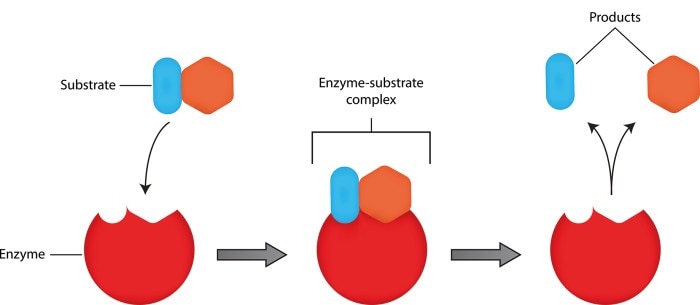
Figure 1: Binding of a substrate to the active site of the enzyme, which then forms the enzyme-substrate complex. Two products result from this reaction.
Enzyme kinetics describes the speed at which an enzyme-catalyzed chemical reaction proceeds. First and foremost, the speed of the reaction depends on the amount of the enzyme used as well as on the amount of substrate. Whereas speed increases proportionally to the concentration of the enzyme, should substrate be added, speed will at first increase in a linear fashion until it eventually approaches a maximum speed. In addition, the activity of the enzyme and, as a result, the course of the reaction, is influenced by additional environmental factors such as pH, temperature or salt concentration.
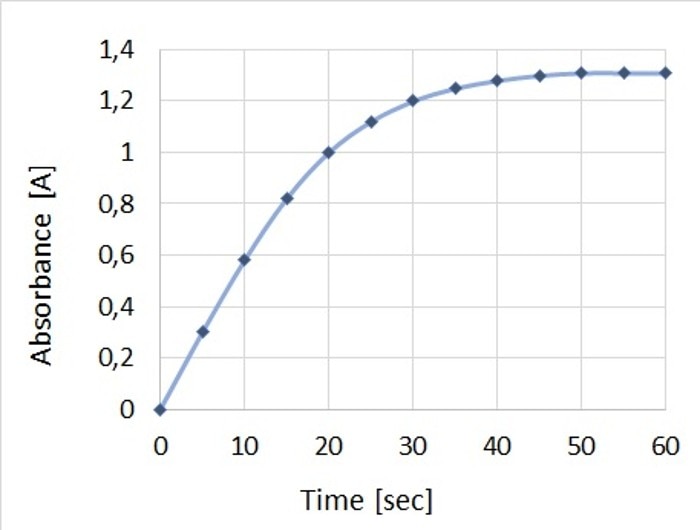
Enzyme assays are mainly carried out for the purpose of characterizing the enzyme through its activity. The concentration of the substrate, too, can be determined using this technique. Measurement methods are based on determining the decrease in substrate (or the increase in product, respectively) over a defined time interval. The required value can be calculated from the measured parameters. Since assays can only be compared with one another if all reaction conditions are the same, parameters such as a suitable pH, the buffer and the temperature must be defined and kept constant throughout the duration of the reaction. The physiological conditions present inside the organism from which the enzyme originates may serve as a guideline for the reaction conditions employed in the laboratory. For the purpose of analysis, the linear range of the reaction curve is critical and is quite often observed in the initial phase of the reaction, which also displays the highest reaction speed. At this time, the reaction is not yet impeded by either diminishing substrate concentrations or by possible inhibitory effects of the product (Figure 2).
Enzyme assays are mainly carried out for the purpose of characterizing the enzyme through its activity. The concentration of the substrate, too, can be determined using this technique. Measurement methods are based on determining the decrease in substrate (or the increase in product, respectively) over a defined time interval. The required value can be calculated from the measured parameters. Since assays can only be compared with one another if all reaction conditions are the same, parameters such as a suitable pH, the buffer and the temperature must be defined and kept constant throughout the duration of the reaction. The physiological conditions present inside the organism from which the enzyme originates may serve as a guideline for the reaction conditions employed in the laboratory. For the purpose of analysis, the linear range of the reaction curve is critical and is quite often observed in the initial phase of the reaction, which also displays the highest reaction speed. At this time, the reaction is not yet impeded by either diminishing substrate concentrations or by possible inhibitory effects of the product (Figure 2).
Read more
Figure 2: Depiction of the change in absorbance over time for a representative enzyme assay, which shows the linear range and thus the highest reaction speed in the early phase.
Different analysis techniques may be employed in order to capture the changes in concentration of the substrate or the product over a defined period of time. Optical methods, especially UV-Vis spectrophotometry, lend themselves particularly well to this task. Here, absorbance is measured at a defined wavelength – either continually or at defined time points. Continual measurements have the advantage of allowing the entire process to be monitored. In this way, the behavior of the assay can be monitored for deviations and the linear range is easy to define. Enzyme activity may then be calculated from the change in absorbance per unit of time.
A simple photometer may suffice as the only equipment needed if the method requires only one or two data points. These measurements can then be carried out manually with the help of a timer. If continual measurements with multiple data points are performed, an instrument is needed that is capable of measuring absorbance over time. In addition, a temperature-controlled cuvette shaft will help accurately control the temperature of the sample. When choosing the cuvette, care must be taken (as with every photometric measurement): Ensure that it is sufficiently transparent to the wavelengths selected, that it is physically compatible with the photometer, and that sufficient amounts of sample are available to satisfy the required filling volume of the cuvette. If the temperature of a sample needs to be controlled and adjusted, macro-cuvettes are recommended. They provide full contact with the cuvette shaft and therefore ensure reliable and fast temperature adaptions.
For the measurement process, suitable environmental parameters (such as temperature and pH) should be determined. Their consistency throughout the entire experiment should be safeguarded as they can heavily influence enzyme activity. Parameters to be defined include measurement wavelength, temperature and duration of the measurement, with defined measurement intervals if applicable. Accurate pipetting and careful mixing are critical. In addition, care must be taken to start the measurement immediately after addition of the final reagent.
In general, analysis utilizes only the linear range of the curve of an enzyme assay. Uncomplicated analyses can be performed with only one (if the blank is used as a second data point) or two measurements. For this type of analysis, however, the course of the reaction should be known. In contrast, continual measurements necessitate more complex analyses. Here, the data points are analyzed via linear regression, which calculates the change in absorbance per minute.
In the case of automated analysis, data points that fall outside the linear range are also taken into account (Figure 3A). In this case, it is necessary to adjust the beginning and end points in such a way that they limit – and thus define – the linear range (Figure 3B). In this way, the reaction speed, which corresponds to enzyme activity, can be calculated accurately.
The resulting enzyme concentration is expressed in number of units per volume, (e.g., U/L). It is defined as 1 µmol of substrate converted in 1 minute under defined standard conditions.
Read more
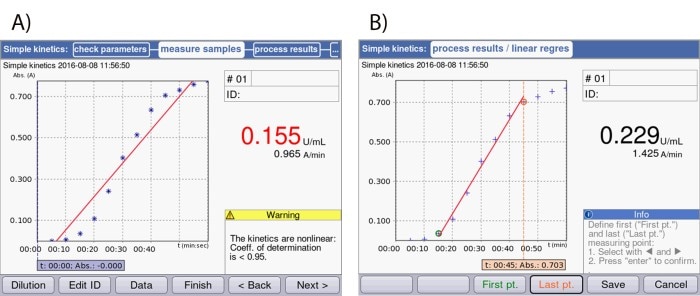
Figure 3: Screenshots of the display of the Eppendorf BioSpectrometer® kinetic: (A) Depiction of an enzyme kinetic directly after measurement without limiting the time window. (B) Depiction of the same enzyme kinetic following adjustment of the start and end points.
Related documents
Userguide
PDF
Application Note
PDF