MENU
BR | BRL

BR | BRL
-
- Todas as pipetas, dispensadores e equipamentos para manuseio de líquidos automatizados
- Todas as micropipetas
- Pipetas mecânicas
- Pipetas eletrônicas
- Pipetas multicanal
- Pipetas de deslocamento positivo e dispensadores
- Dispensadores de frascos
- Controladores de pipeta
- Acessórios para dispensadores e pipetas
- Pipetagem Automatizada
- Consumíveis de automação
- Acessórios de automação
- Serviços para pipetas e equipamentos para manuseio de líquidos
Sorry, we couldn't find anything on our website containing your search term.
Sorry, we couldn't find anything on our website containing your search term.
- Home
- Beyond Science
- Off the Bench
- Exploring Life
- When Data Reach the Ear
When Data Reach the Ear
Explore Life Science
- Other
- Off the Bench
- Exploring Life
Data sonification renders measured values audible – and may even elicit an emotional response.
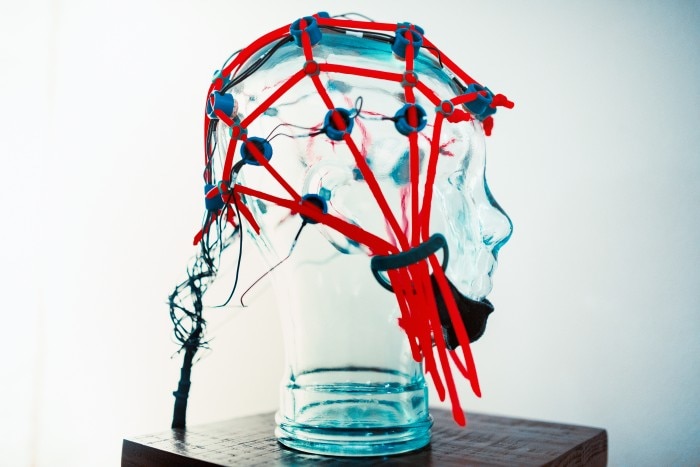
The image of a brain illuminates the large screen on one of the walls inside the Hasso Plattner Institute (HPI) in Potsdam. In front of this screen, six black-and-white speakers on tripods are distributed across the room. Suddenly, sounds emanate: a fast-paced ping from the front left, a plucking sound from behind to the left, and a deep “whoop whoop” from all directions. In time with the sounds, colorful circles light up all over the brain’s image. The sounds represent the frequencies of firing neurons, captured during electroencephalography (EEG) – theta waves, for example, which exist during sleep, or alpha waves recorded when eyes are closed. The research project “Brain Data Sonification” enabled the translation of such brain activities into sounds in the room, dependent on the brain region in which the waves were captured.
“Printouts of EEG data look quite complicated”, says Luca Hilbrich who, together with Philipp Steigerwald and Tim Strauch, developed “Brain Data Sonification”. As graduate students, the three had been members of the neurodesign team at the HPI. Data normally shown in the form of complex wavy lines on paper become much clearer through the sound representation achieved by their project. You can virtually listen to the brain at work.
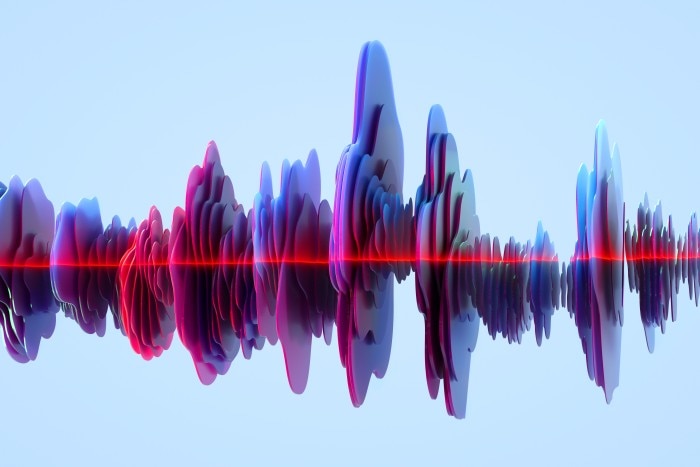
The process through which complex EEG recordings can be transformed into 3-dimensional sounds goes by the term “Data Sonification”. It is an equivalent to visual depiction of data via infographics – except information is not translated into the height of a bar, the width of a piece of pie, or a color palette, but rather into different sounds.
“Printouts of EEG data look quite complicated”, says Luca Hilbrich who, together with Philipp Steigerwald and Tim Strauch, developed “Brain Data Sonification”. As graduate students, the three had been members of the neurodesign team at the HPI. Data normally shown in the form of complex wavy lines on paper become much clearer through the sound representation achieved by their project. You can virtually listen to the brain at work.
Sounds instead of bars and colors
The process through which complex EEG recordings can be transformed into 3-dimensional sounds goes by the term “Data Sonification”. It is an equivalent to visual depiction of data via infographics – except information is not translated into the height of a bar, the width of a piece of pie, or a color palette, but rather into different sounds. Ler mais
© Getty Images / RyanJlane
The ability to transform measured data into acoustic signals is not new. Geiger counters, for example, which display the strength of ionizing radiation via electronic clicks, have been around for more than a hundred years. Today, data sonification is widely used in everyday applications; one example is the increasing beeping utilized in cars to indicate their distance to the closest object during parking.
Matching the human auditory spectrum
In research, sonification is used primarily when large data sets are to be presented in a way that showcases a timed sequence. Here, data sets are often translated directly into sound waves – frequently using temporal compression and modifications in pitch in order to move the result into the range of the human auditory spectrum. In this way, as early as 1953, seismic scientist Hugo Benioff at Caltech University in the US replayed recordings of earthquake waves at an accelerated speed and thus rendered them audible.
A different approach involves the symbolic assignment of sounds to certain data. Even sound characteristics such as pitch, volume, tempo or duration may represent developments and events within the data set. These days, this method allows the sonification of changes with respect to global warming. The rapidly rising temperature readings in the oceans, for example, are represented in the form of an increasing scream. NASA, too, has been systematically transforming observational data obtained from telescopes such as Hubble, the James Webb Space Telescope, or the Chandra X-ray Observatory into sounds in order for the findings to reach more people. In addition to this method of science communication, blind astronomer Wanda Diaz-Merced uses audible telescope data for her scientific work: she studies space via her ears. Data sonification thus lends itself equally to reaching a wider audience as well as to solid hands-on research.
Impressionist approach
At the same time, the majority of scientific data is preferably conveyed in visual form.
“People trust information if they can see it – but not if they can only hear it”, says British data journalist and musician Miriam Quick, who, together with information designer Duncan Geere, runs the sonification studio Loud Numbers. The team offers data sonification for NGOs, cultural institutions and research organizations, and they host a podcast on the topic. They are also behind a small online community named Decibels which offers a platform for exchange. According to Quick, an impressionistic approach to sound, which is mostly geared towards making a certain impression on their audience rather than simply providing information, can in many cases work much better than a graphic illustration.
For one project, Loud Numbers coupled the progressively steep curve of the CO2 content within the atmosphere to the increasingly high-pitched and shrill sound of a siren. “One can use sounds that are so loud that they will elicit physical pain; a bar graph will never be so long as to be painful”, says Duncan Geere of Loud Numbers.
Matching the human auditory spectrum
In research, sonification is used primarily when large data sets are to be presented in a way that showcases a timed sequence. Here, data sets are often translated directly into sound waves – frequently using temporal compression and modifications in pitch in order to move the result into the range of the human auditory spectrum. In this way, as early as 1953, seismic scientist Hugo Benioff at Caltech University in the US replayed recordings of earthquake waves at an accelerated speed and thus rendered them audible.A different approach involves the symbolic assignment of sounds to certain data. Even sound characteristics such as pitch, volume, tempo or duration may represent developments and events within the data set. These days, this method allows the sonification of changes with respect to global warming. The rapidly rising temperature readings in the oceans, for example, are represented in the form of an increasing scream. NASA, too, has been systematically transforming observational data obtained from telescopes such as Hubble, the James Webb Space Telescope, or the Chandra X-ray Observatory into sounds in order for the findings to reach more people. In addition to this method of science communication, blind astronomer Wanda Diaz-Merced uses audible telescope data for her scientific work: she studies space via her ears. Data sonification thus lends itself equally to reaching a wider audience as well as to solid hands-on research.
Impressionist approach
At the same time, the majority of scientific data is preferably conveyed in visual form. “People trust information if they can see it – but not if they can only hear it”, says British data journalist and musician Miriam Quick, who, together with information designer Duncan Geere, runs the sonification studio Loud Numbers. The team offers data sonification for NGOs, cultural institutions and research organizations, and they host a podcast on the topic. They are also behind a small online community named Decibels which offers a platform for exchange. According to Quick, an impressionistic approach to sound, which is mostly geared towards making a certain impression on their audience rather than simply providing information, can in many cases work much better than a graphic illustration.
For one project, Loud Numbers coupled the progressively steep curve of the CO2 content within the atmosphere to the increasingly high-pitched and shrill sound of a siren. “One can use sounds that are so loud that they will elicit physical pain; a bar graph will never be so long as to be painful”, says Duncan Geere of Loud Numbers.
Ler mais