メニュー
JP | JPY
-
-
- Challenges and Chances: A Review of the 1st Stem Cell Community Day
- Summertime, and the Livin’ Is Easy…
- Follow-on-Biologics – More than Simple Generics
- Bacteria Versus Body Cells: A 1:1 Tie
- Behind the Crime Scene: How Biological Traces Can Help to Convict Offenders
- Every 3 Seconds Someone in the World Is Affected by Alzheimer's
- HIV – It’s Still Not Under Control…
- How Many Will Be Convicted This Time?
- Malaria – the Battle is Not Lost
- Physicians on Standby: The Annual Flu Season Can Be Serious
- At the Forefront in Fighting Cancer
- Molecular Motors: Think Small and yet Smaller Again…
- Liquid Biopsy: Novel Methods May Ease Cancer Detection and Therapy
- They Are Invisible, Sneaky and Disgusting – But Today It’s Their Special Day!
- How Many Cells Are in Your Body? Probably More Than You Think!
- What You Need to Know about Antibiotic Resistance – Findings, Facts and Good Intentions
- Why Do Old Men Have Big Ears?
- The Condemned Live Longer: A Potential Paradigm Shift in Genetics
- From Research to Commerce
- Chronobiology – How the Cold Seasons Influence Our Biorhythms
- Taskforce Microbots: Targeted Treatment from Inside the Body
- Eyes on Cancer Therapy
-
-
-

-
-
- Challenges and Chances: A Review of the 1st Stem Cell Community Day
- Summertime, and the Livin’ Is Easy…
- Follow-on-Biologics – More than Simple Generics
- Bacteria Versus Body Cells: A 1:1 Tie
- Behind the Crime Scene: How Biological Traces Can Help to Convict Offenders
- Every 3 Seconds Someone in the World Is Affected by Alzheimer's
- HIV – It’s Still Not Under Control…
- How Many Will Be Convicted This Time?
- Malaria – the Battle is Not Lost
- Physicians on Standby: The Annual Flu Season Can Be Serious
- At the Forefront in Fighting Cancer
- Molecular Motors: Think Small and yet Smaller Again…
- Liquid Biopsy: Novel Methods May Ease Cancer Detection and Therapy
- They Are Invisible, Sneaky and Disgusting – But Today It’s Their Special Day!
- How Many Cells Are in Your Body? Probably More Than You Think!
- What You Need to Know about Antibiotic Resistance – Findings, Facts and Good Intentions
- Why Do Old Men Have Big Ears?
- The Condemned Live Longer: A Potential Paradigm Shift in Genetics
- From Research to Commerce
- Chronobiology – How the Cold Seasons Influence Our Biorhythms
- Taskforce Microbots: Targeted Treatment from Inside the Body
- Eyes on Cancer Therapy
-
-
-
JP | JPY
Sorry, we couldn't find anything on our website containing your search term.
Photometric Quantification of Proteins in Aqueous Solutions via UV-Vis Spectroscopy
Lab Academy
- 測光
- 分光光度計
- エッセー
The protein concentration within a solution can be measured using a number of different processes – all of which present advantages as well as disadvantages.
The following three types of quantification are most commonly found in the laboratory:
1) Direct quantification via absorbance measurement in the UV-range
2) Indirect quantification via colorimetric assay (click for further information)
3) Indirect quantification via fluorometric assay ( )
Methods 1 and 2 are based on absorbance measurements using the UV-Vis spectrometer, whereas method 3 requires a fluorometer, or a photometer with a fluorometric auxiliary module.
Different methods for the direct quantification of proteins using UV-Vis spectroscopy are detailed below.
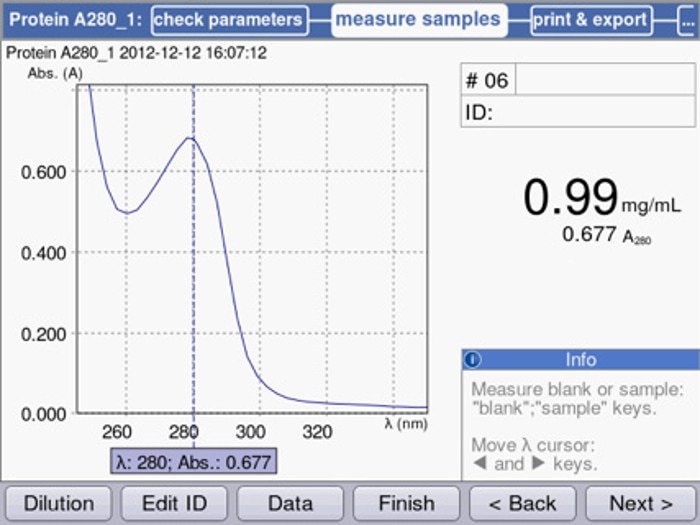
The direct methods are performed within a measurement range between approximately 200 and 340 nm (figure 1), where the wavelength range above 320 nm is used to examine whether a sample includes photometric background noise. If this is the case, the cause may be either contamination of the sample, air bubbles, contamination of the cuvette or even contamination of the photometer.
1) Direct quantification via absorbance measurement in the UV-range
2) Indirect quantification via colorimetric assay (click for further information)
3) Indirect quantification via fluorometric assay ( )
Methods 1 and 2 are based on absorbance measurements using the UV-Vis spectrometer, whereas method 3 requires a fluorometer, or a photometer with a fluorometric auxiliary module.
Different methods for the direct quantification of proteins using UV-Vis spectroscopy are detailed below.
The direct methods are performed within a measurement range between approximately 200 and 340 nm (figure 1), where the wavelength range above 320 nm is used to examine whether a sample includes photometric background noise. If this is the case, the cause may be either contamination of the sample, air bubbles, contamination of the cuvette or even contamination of the photometer.
もっと読む
Figure 1: UV-Vis spectrometric scan of a homogeneous protein solution
Advantage:
The advantage of direct measurement is the speed of the method, as samples simply need to be inserted into the photometer, and results are displayed instantly. In addition to the quantitative result, the shape of the scanning curve reveals information on the quality of the sample.
Disadvantage:
Relatively high sample concentrations are required for quantification using the direct method. High sample purity is further crucial in order to guarantee accurate determination of the sample concentration as other organic substances, which may be present as contaminants, frequently also absorb light in the UV-range. Since contamination can never be completely ruled out, quantification methods that rely on UV light will always be somewhat prone to interference.
Possible direct quantification methods:
All methods introduced herein are based on measurements using a cuvette with a path length of 1 cm.a) Quantification using the specific absorbance coefficient at 280 nm (1):
Absorbance at 280 nm is based foremost on the presence of amino acids with aromatic residues within the protein, such as tryptophan and tyrosine and, to a lesser extent, phenylalanine. The protein to be measured must be present as a homogeneous solution.
Calculations are performed using the formula C = A x F (C = concentration of the protein; A = measured absorption of the sample using the photometer; F = specific protein factor).
The factor is calculated from the specific absorption coefficient (l/(mol*cm)) and the molecular weight of the protein in Dalton (g/mol):
FProtein (mg/mL)= M/Ɛ
If the amino acid sequence of the protein is known, the molecular weight, as well as the extinction coefficient, may be defined using certain online programs, for example:
https://web.expasy.org/protparam/
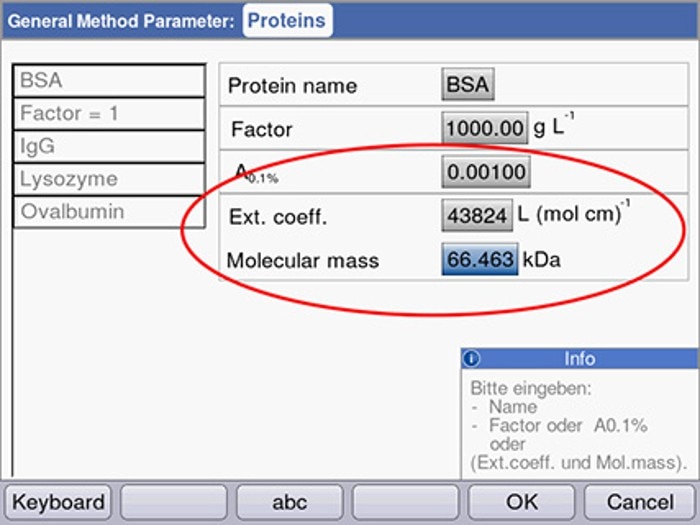
In the Eppendorf BioPhotometer® and Eppendorf BioSpectrometer® , the factor F may be determined by using an integrated calculation tool, taking into consideration the extinction coefficient as well as the molecular mass of the protein (figure 2).
もっと読む
Figure 2: Calculation of the factor in the Eppendorf BioPhotometer or BioSpectrometer through entering the extinction coefficient (at 280 nm) and the molecular weight of the protein.
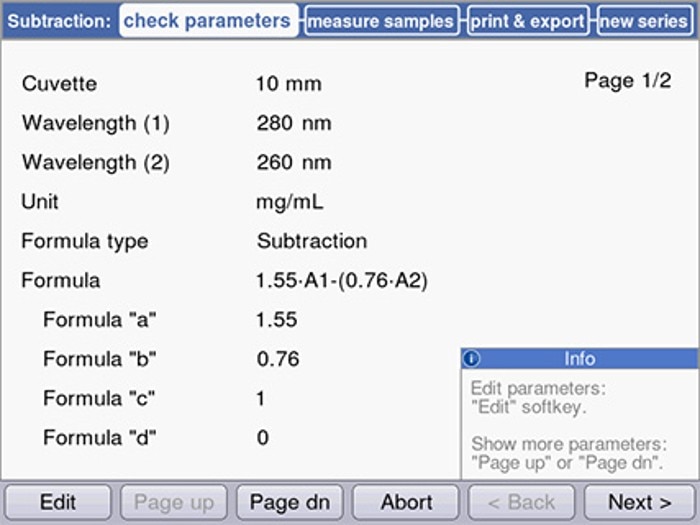
b) Quantification using the Warburg formula (2)
Determination of protein concentration via the Warburg formula is primarily suitable for heterogeneous protein solutions, as well as under circumstances under which the factor of the protein cannot be determined as described in (a). In addition, possible contaminations through nucleic acids are taken into consideration. Other organic substances, however, will also distort the result, as described for the factor method. This method is generally regarded as very imprecise and its use is limited to those cases which display a 280 nm/260 nm absorbance ratio of > 0.6.
The concentration is calculated via the following formula:
CProtein(mg/mL) = (1.55 × A280) - (0.76 × A260)
Figure 3 shows an example of programming on the Eppendorf BioSpectrometer® .
もっと読む
Figure 3: Programming of the Warburg formula on the Eppendorf BioSpectrometer
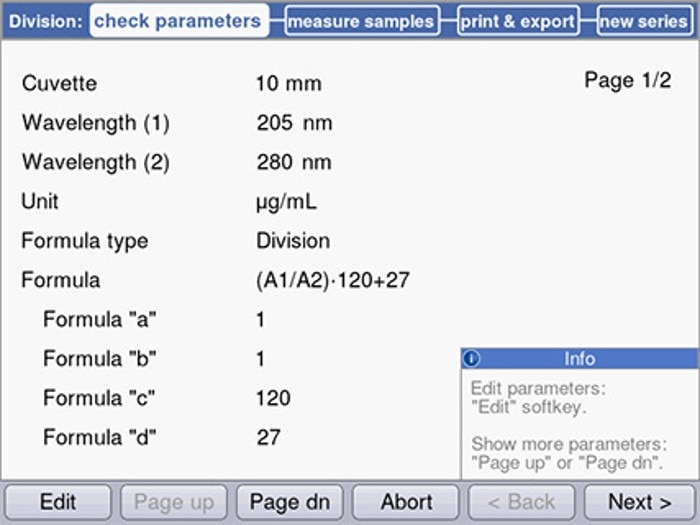
c) Protein determination according to Scopes (3)
A further method, which is not as broadly applied as the methods described above, is protein quantification using the Scopes method. It is based on light absorbance through the peptide bond at 205 nm. In addition, this method, similar to method (a), takes the presence of tryptophan and tyrosine residues within the protein into consideration. While this method is also considered rather prone to disruption by other organic substances, if applied to homogeneous solutions, the variations between individual proteins are relatively minor. Calculation of the concentration is performed as follows:
CProtein= 27 + 120 (A205/A280)
Figure 4 shows programming on the Eppendorf BioSpectrometer.
もっと読む
Figure 4: Entry of the parameters for the Scopes method
[1] Pace, C. N., Vajdos, F., Fee, L., Grimsley, G., and Gray, T. (1995). How to measure and predict the molar absorption coefficient of a protein. Protein Sci. 4, 2411–2423.
[2] Lottspeich/Zsorbas – Bioanalytik (1998)
[3] Scopes, R. K. (1974). Measurement of protein by spectrophotometry at 205 nm. Anal. Biochem. 59, 277–282.
[2] Lottspeich/Zsorbas – Bioanalytik (1998)
[3] Scopes, R. K. (1974). Measurement of protein by spectrophotometry at 205 nm. Anal. Biochem. 59, 277–282.
もっと読む