メニュー
JP | JPY
-
-
- Challenges and Chances: A Review of the 1st Stem Cell Community Day
- Summertime, and the Livin’ Is Easy…
- Follow-on-Biologics – More than Simple Generics
- Bacteria Versus Body Cells: A 1:1 Tie
- Behind the Crime Scene: How Biological Traces Can Help to Convict Offenders
- Every 3 Seconds Someone in the World Is Affected by Alzheimer's
- HIV – It’s Still Not Under Control…
- How Many Will Be Convicted This Time?
- Malaria – the Battle is Not Lost
- Physicians on Standby: The Annual Flu Season Can Be Serious
- At the Forefront in Fighting Cancer
- Molecular Motors: Think Small and yet Smaller Again…
- Liquid Biopsy: Novel Methods May Ease Cancer Detection and Therapy
- They Are Invisible, Sneaky and Disgusting – But Today It’s Their Special Day!
- How Many Cells Are in Your Body? Probably More Than You Think!
- What You Need to Know about Antibiotic Resistance – Findings, Facts and Good Intentions
- Why Do Old Men Have Big Ears?
- The Condemned Live Longer: A Potential Paradigm Shift in Genetics
- From Research to Commerce
- Chronobiology – How the Cold Seasons Influence Our Biorhythms
- Taskforce Microbots: Targeted Treatment from Inside the Body
- Eyes on Cancer Therapy
-
-
-

-
-
- Challenges and Chances: A Review of the 1st Stem Cell Community Day
- Summertime, and the Livin’ Is Easy…
- Follow-on-Biologics – More than Simple Generics
- Bacteria Versus Body Cells: A 1:1 Tie
- Behind the Crime Scene: How Biological Traces Can Help to Convict Offenders
- Every 3 Seconds Someone in the World Is Affected by Alzheimer's
- HIV – It’s Still Not Under Control…
- How Many Will Be Convicted This Time?
- Malaria – the Battle is Not Lost
- Physicians on Standby: The Annual Flu Season Can Be Serious
- At the Forefront in Fighting Cancer
- Molecular Motors: Think Small and yet Smaller Again…
- Liquid Biopsy: Novel Methods May Ease Cancer Detection and Therapy
- They Are Invisible, Sneaky and Disgusting – But Today It’s Their Special Day!
- How Many Cells Are in Your Body? Probably More Than You Think!
- What You Need to Know about Antibiotic Resistance – Findings, Facts and Good Intentions
- Why Do Old Men Have Big Ears?
- The Condemned Live Longer: A Potential Paradigm Shift in Genetics
- From Research to Commerce
- Chronobiology – How the Cold Seasons Influence Our Biorhythms
- Taskforce Microbots: Targeted Treatment from Inside the Body
- Eyes on Cancer Therapy
-
-
-
JP | JPY
Sorry, we couldn't find anything on our website containing your search term.

Verification of Photometric Measurement Values at a Glance
Natascha Weiß Lab Academy
- 細胞生物学
- 測光
- 分光光度計
- エッセー
A quick check of the measured data based on the following key parameters increases the certainty that the results are reliable.
Assessing concentration and purity of nucleic acid solutions via photometric measurements constitutes a routine method in the molecular biology laboratory. Whether a complete absorbance spectrum is obtained from a sample, or whether absorbance is determined at defined wavelengths only, it makes sense to subject the results to quick check. This step not only helps determine the purity of the sample, but it also serves the purpose of evaluating the quality of the measurement itself.
1. Does the absorbance value A260 fall within the linear range of the photometer (0.1 – 1.0 A*)?
2. Is background absorbance (wavelengths ≥ 320 nm) absent or reduced to a minimum, and is background correction activated?
3. Does the ratio A260/A280 fall within the range of approximately 1.8 – 2.0?
4. Does the ratio A260/A230 fall within the range of approximately 2.0 – 2.5?If one or more of the values deviate from the expected range, it may be necessary to analyze the measurement process, or the sample, more closely and, if applicable, follow one of the approaches to solution listed below.
The technical specifications of a photometer often include the photometric measurement range. It specifies the absorbance range that is read by the instrument, but it reveals little about the quality of these data. Absorbance values follow a linear curve only within a limited range of measurement – generally between 0.1 A and 1.0 A, depending on the optical construction and the quality of the instrument; this range may extend beyond these values*.
Absorbance at 260 nm < 0.1*: In the case of a sample of low concentration, the impact of all inaccuracies during sample preparation and measurement will be magnified and thus compromise the accuracy and precision of the results. Sample concentration can be increased through either lower dilution factors or through concentration of the sample. If possible, the light path may be increased by employing a cuvette with a longer path length, or, alternatively, the sample may be quantified using fluorescence. The emergence of negative values is often a consequence of incorrect sample preparation or blank measurement. In such cases, the possibility of a mix-up of blank and sample prior to measurement should be investigated, as well as suitability of the blank solution used.
Absorbance at 260 nm > 1.0*: A highly concentrated sample, too, may lead to measurement inaccuracies, as values are influenced by light scatter (figure 1). In this case, approaches to solutions include sample dilution or the use of a shorter light path, for example, through the use of a cuvette with shorter path length.
1. Does the absorbance value A260 fall within the linear range of the photometer (0.1 – 1.0 A*)?
2. Is background absorbance (wavelengths ≥ 320 nm) absent or reduced to a minimum, and is background correction activated?
3. Does the ratio A260/A280 fall within the range of approximately 1.8 – 2.0?
4. Does the ratio A260/A230 fall within the range of approximately 2.0 – 2.5?If one or more of the values deviate from the expected range, it may be necessary to analyze the measurement process, or the sample, more closely and, if applicable, follow one of the approaches to solution listed below.
1. Linear measurement range
The technical specifications of a photometer often include the photometric measurement range. It specifies the absorbance range that is read by the instrument, but it reveals little about the quality of these data. Absorbance values follow a linear curve only within a limited range of measurement – generally between 0.1 A and 1.0 A, depending on the optical construction and the quality of the instrument; this range may extend beyond these values*.Absorbance at 260 nm < 0.1*: In the case of a sample of low concentration, the impact of all inaccuracies during sample preparation and measurement will be magnified and thus compromise the accuracy and precision of the results. Sample concentration can be increased through either lower dilution factors or through concentration of the sample. If possible, the light path may be increased by employing a cuvette with a longer path length, or, alternatively, the sample may be quantified using fluorescence. The emergence of negative values is often a consequence of incorrect sample preparation or blank measurement. In such cases, the possibility of a mix-up of blank and sample prior to measurement should be investigated, as well as suitability of the blank solution used.
Absorbance at 260 nm > 1.0*: A highly concentrated sample, too, may lead to measurement inaccuracies, as values are influenced by light scatter (figure 1). In this case, approaches to solutions include sample dilution or the use of a shorter light path, for example, through the use of a cuvette with shorter path length.
もっと読む
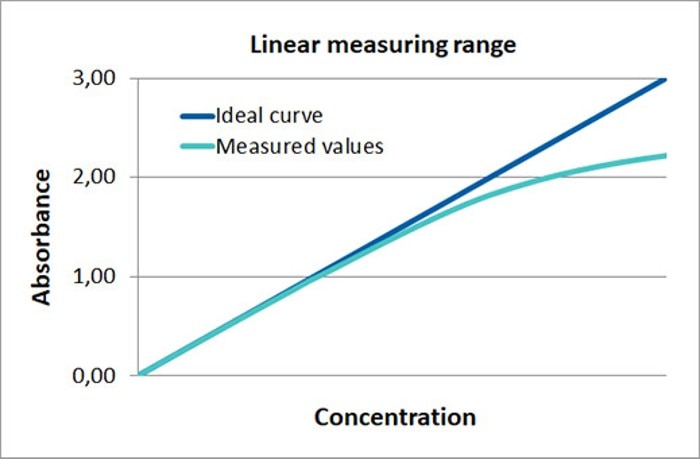
Figure 1: Depiction of the linear dependence between absorbance and concentration in photometry (ideal curve). In the case of high sample concentration, the light scatter that occurs inside the photometer exerts an increasing influence on the result (measured values), so that the linear relationship between measured absorbance and calculated concentration is no longer upheld.
2. Background measurement (turbidity measurement)
Background measurements for nucleic acids are mostly conducted at 320 nm, as neither the sample nor possible organic contaminants absorb light at this wavelength. Instead, particles (e.g. microorganisms, magnetic beads, precipitates) and air bubbles present in the sample are captured. Even if the meniscus of the sample solution crosses the light path, or if the cuvette is smudged or dirty, or even damaged, an absorbance reading will be recorded at this wavelength.Absorbance at 320 nm > 0: Absorbance detected at this wavelength indicates that all readings within a measurement will be influenced; it means that the calculated concentrations are too high, and that purity ratios are also distorted (figure 2). The ability to activate a background correction feature, a useful property of photometers, ensures that absorbance at this wavelength is automatically subtracted from all measured wavelengths. In this way, the calculations of the concentrations, as well as the purity ratios, are corrected. However, editing of the measured values is only beneficial in cases of low absorbance (approximately up to 0.03 A). If a noticeable background is present, it is imperative to identify and eliminate the source.
もっと読む
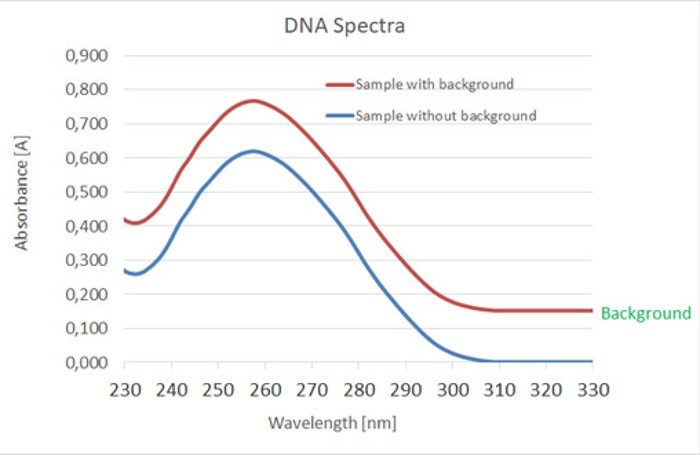
Figure 2: A background leads to increased measured values in the entire absorbance range.
Purity Ratios
Two purity ratios are routinely employed for the analysis of nucleic acids: the ratios of the absorbance values obtained at 260 nm and 280 nm (A260/A280) as well as 260 nm und 230 nm (A260/A230). Nucleic acids with a ratio A260/A280 of 1.8 – 2.0 and a ratio A260/A230 of 2.0 – 2.5 are considered pure, while taking into consideration the fact that the solvent and the pH will influence these values [1]. Values that are too low generally indicate that contaminations, such as proteins or reagents that were used during the purification process, are present in the sample. Large deviations, even elevated values, may arise if a different solvent was used for the blank from the one used to dissolve the samples.Ratio A260/A280 < 1.8 and/or ratio A260/A230 < 2.0: Contaminations within the sample solution frequently lead to increased absorbance at a wavelength of 260 nm and therefore to erroneous calculations of sample concentrations. Furthermore, subsequent experiments may be compromised by contaminants. In cases of heavy contamination, or during the course of sensitive reactions, it may be necessary to subject the samples to an additional purification step. Alternatively, exact quantification can be achieved through fluorescence.
Ratio A260/A280 and/or ratio A260/A230 show significant deviations: Often, very high, or very low, purity ratios can be attributed to errors during preparation or during the measurement process itself.
* The exact values are dependent on the properties of the instrument. The linear absorbance ranges of the Eppendorf BioPhotometer D30 and the BioSpectrometer cover the range between 0.05 A and 2.0 A.
もっと読む
Related documents
Userguide
PDF